
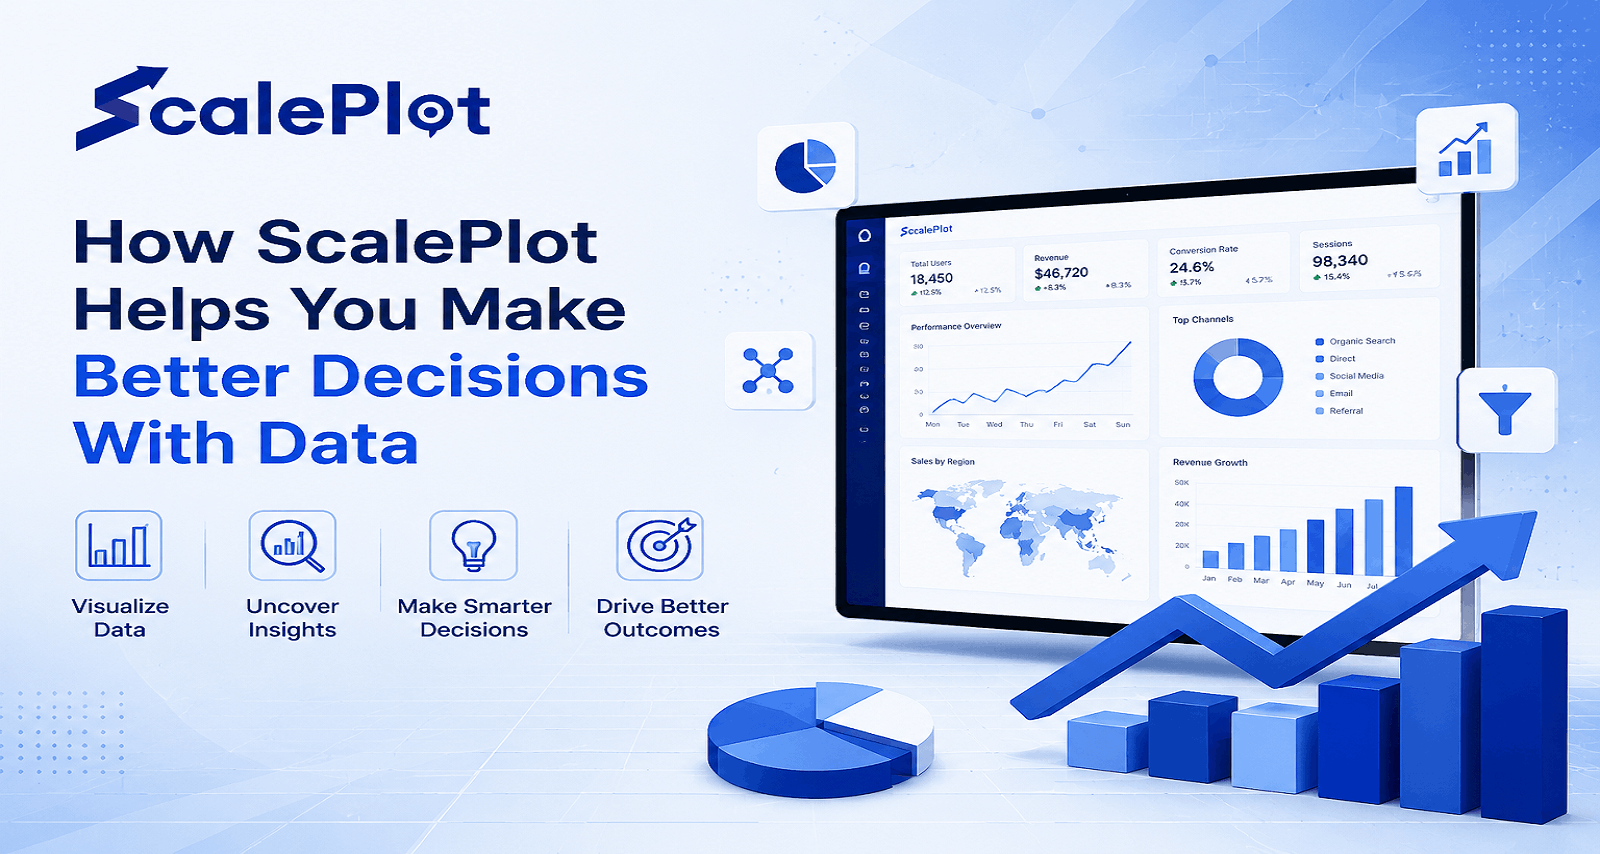
Key Takeaways For Building A More Data-Driven Business
- Get one clear view of your business. We connect your separate systems so everyone in the office looks at the same numbers. No more arguments about which report is “right.”
- Stop wasting time on manual reports. We build automated dashboards that update themselves. You can get your Sunday evenings back instead of spending them in Excel.
- Make choices based on facts. Better data helps you see a trend before it becomes a crisis. You can spot a drop in sales or a rise in costs in days, not months.
- We handle the heavy lifting. From checking your data quality to setting up the software, our team does the technical work so you can stay focused on your customers.
- Use AI for a head start. We use AI solutions to find patterns humans might miss, but you stay in the driver’s seat for every final decision.
- Build a system that grows. A good data plan isn’t a one-time project. It’s a cycle that keeps your business efficient as you scale up in the Texas market.
If you run a company in a competitive hub like Dallas, Texas USA, you know that speed is everything. Every day, your systems hum with information. Your sales team logs calls in a CRM. Your warehouse tracks shipments. Your accounting software records every penny spent. You probably have more data than you knw what to do with.
The problem is that most of this information just sits there. When you actually need to make a big decision—like whether to hire more staff or open a new location—you aren’t looking at a clear dashboard. Instead, you are probably digging through old emails, waiting for a manager to send over a report, or trying to make sense of three different spreadsheets that don’t match.
Making big moves based on gut feelings is a gamble that eventually catches up to you. ScalePlot exists to change that. We are a business consulting partner that helps you stop drowning in numbers and start using them to win. This guide will show you exactly how we turn scattered reports into a clear, winning business strategy.
Why Businesses Struggle To Make Data-Driven Decisions
It is a common story. A business starts small, and the owner knows every number by heart. But as you grow, you add more people and more software. Suddenly, the “big picture” disappears. Many leaders in Dallas, Texas USA find that having more data actually makes it harder to see what is going on.
Data Is Everywhere, but Insights Are Missing
Your sales team likely uses one platform, while your finance team uses another. These systems are like islands; they rarely talk to each other. This is what experts call “data silos.” These silos cause major problems because they block the flow of information across your company. When information is trapped in one department, you can’t see the full story.
For example, your sales report might show a record-breaking month. But if your shipping data shows that half those orders arrived late and your finance report shows high return costs, you aren’t actually winning. Without a “single source of truth,” you are only seeing a small piece of the puzzle. Companies that focus on fixing data silos find it much easier to act on facts rather than guesses. You have plenty of data, but no real insights.
The Spreadsheet Trap
As a business grows, the “spreadsheet headache” gets worse. Many teams in North Texas still spend ten or twenty hours a week just moving numbers from one file to another. This manual work is slow, and let’s be honest, it’s boring.
It also leads to mistakes. One wrong formula or a copy-paste error can ruin an entire month’s forecast. If it takes your team until Thursday to finish the report for last week, you are always looking in the rearview mirror. You can’t be proactive when your data is always four days late. This is a primary reason why companies look for a business intelligence partner.
The Real Cost of Guessing
When you don’t have reliable insights, you start making guesses. You might over-order inventory because you think a busy season is coming, only to have it sit in the warehouse for months. Or, you might miss a chance to raise prices because you didn’t realize your costs went up two months ago.
Poor data decisions also frustrate your customers. If your support team can’t see a customer’s full order history because it’s in a different system, the customer has to repeat themselves. These small inefficiencies add up to lost revenue and higher operating costs. In a fast-moving market like Dallas, these delays give your competitors an opening to move in.
What Is ScalePlot?
ScalePlot business consulting is a team of experts who believe data should be easy to use. We aren’t just here to sell you a piece of software. We are here to help you solve business problems using data intelligence.
Who Is ScalePlot?
We are a mix of business consultants, data scientists, and strategists. We understand that technology is only useful if it helps you reach your goals. We have spent years helping companies across the USA simplify their operations. We specialize in Business Intelligence, Data Analytics, and Digital Transformation. We don’t just build charts; we build systems that help you grow.
What We Help You Achieve
Our main goal is to give you total visibility. We want you to be able to open your laptop and see exactly how your business is doing at that very moment. We focus on:
- Faster Decision-Making: Moving from “I think” to “I know.”
- Operational Efficiency: Cutting out the manual tasks that waste your team’s time.
- Sustainable Growth: Building a foundation that doesn’t break when you double your sales.
A Local Partner with a Global View
While we work with companies across the country, we have a deep appreciation for the Dallas, Texas business community. We understand the local industries, from logistics hubs near DFW airport to the growing tech and healthcare sectors in the metroplex. We bring that local understanding to every business strategy we develop.
Industries ScalePlot Supports
While every company is unique, many face the same data struggles. We work with a variety of industries to solve these problems:
- Manufacturing: We help track production levels, quality control, and machine downtime.
- Retail and E-commerce: We focus on inventory management and understanding customer buying habits.
- Healthcare: We help organizations manage resources and improve operational visibility.
- Logistics and Supply Chain:* We look at route performance and delivery timing to cut costs.
- Finance: We improve the accuracy of forecasts and simplify executive reporting.
- Professional Services: We help firms track project profitability and team productivity.
How ScalePlot Helps Businesses Turn Data Into Better Decisions
To help your business grow, you need more than just a new piece of software. You need a partner who understands how all the pieces of a company fit together. Here is how ScalePlot uses a mix of strategy and technology to help you make better choices.

Strategic Advisor: Helping You Build a Real Plan
Many business owners in Dallas, Texas USA make the mistake of buying expensive technology before they have a plan. They hope the software will fix their problems, but it often just adds more confusion. As your ScalePlot strategic advisor, we start by asking the big questions.
We look at your long-term goals. We want to know which parts of your business are growing and which parts are struggling. By focusing on your strategy first, we make sure that any data tools we build actually support your goals. We help you move away from reactive choices and toward a clear, proactive plan for the future.
Data Intelligence: Knowing Exactly What Is Going On
Most companies have plenty of data, but it is usually a mess. Your sales numbers might live in one app while your costs live in a spreadsheet. This makes it impossible to see your true profit in real time. Our data intelligence services help you clean up this mess.
We connect your different systems so they finally talk to each other. This gives you one clear place to find all your answers. When you can trust your numbers, you stop arguing about who has the right report. You can spend your time actually running the business instead of digging through files to find a simple answer.
Process Optimization: Removing the Clogs in Your Business
Sometimes a business is slow because the way people work is broken. You might have a process that worked fine when you were small, but now it causes delays. ScalePlot process optimization helps you find where work gets stuck.
We look for things like double data entry or long wait times for approvals. These “bottlenecks” waste time and frustrate your staff. We help you redesign these workflows so they are faster and simpler. When your processes run smoothly, your operating costs go down and your team gets more done.
Tech Automation: Letting Machines Handle the Boring Tasks
If your team spends hours every week typing data into spreadsheets, they are wasting their talent. ScalePlot uses tech automation to handle these repetitive tasks for you. We build systems that move data automatically between your apps.
Automation doesn’t get tired and it doesn’t make typos. It can handle your recurring reports, send out inventory alerts, or track your shipments 24 hours a day. By letting technology do the “busy work,” you free up your people to focus on high-value tasks that actually bring in revenue.
Organizational Development: Getting Your Team Ready
Technology is only useful if your people actually use it. A common mistake is building a great dashboard that no one looks at. This is why we focus on organizational development. We help you prepare your team for these new ways of working.
We provide training that is easy to understand. We also help you look at how your team is structured. As your business in Dallas grows, your roles and responsibilities might need to change. We make sure your staff has the skills and the support they need to succeed in a data-driven environment.
Revenue Growth: Finding Profit Hiding in Your Numbers
The ultimate goal of all this work is to make your business more profitable. We help you find new ways to increase your income by focusing on ScalePlot revenue growth. By looking closely at your customer habits, we can help you see which products are your real winners and which ones are just taking up space.
You will finally understand which marketing efforts are actually working and which ones are just wasting your money. When you have a clear view of your revenue, you can make better choices about where to invest your time and money next. This turns your data into a tool for sustainable, long-term growth.
Business Intelligence: Seeing the Truth of Your Business Every Day
Most people think Business Intelligence is just a fancy name for a bar graph. But for a business owner, it is actually the tool that stops the guessing games. Think about how many times you have had to ask someone in accounting for a specific number, only to wait two days for an answer. Business Intelligence takes all the information from your sales, your bank accounts, and your inventory, and puts it in one spot. It turns those thousands of messy rows in a spreadsheet into a picture that actually makes sense.
In a fast-moving market like Dallas, Texas USA, you can’t afford to look at your data once a month. You need to know what is happening while it is happening. When you have good Business Intelligence in place, you can see if a specific product is failing or if a certain region is suddenly buying more than usual. It gives you the big picture at a glance. You aren’t just looking at what happened in the past; you are seeing exactly where your business stands right now so you can make a move before your competitors even see the opportunity.
ScalePlot’s Step-by-Step Approach To Business Intelligence
We don’t believe in “black box” projects where you don’t know what is happening. We follow a clear, five-step path to get your data in order.
Step 1 – The Discovery Meeting
Everything starts with a talk. We sit down with you to learn about your business. What are your biggest headaches? What goals are you trying to hit this year? We define your KPIs (Key Performance Indicators) early so we know exactly what we are trying to measure. This ensures the final project actually helps your business, rather than just looking good on screen.
Step 2 – Assessing Your Data
Next, we look at your current “data landscape.” We check your CRM, your accounting software, and your inventory logs. We look for “dirty data”—information that is missing, duplicated, or formatted incorrectly. We also check for security risks to make sure your customer information is protected.
Step 3 – Preparing the Foundation
Before we build a dashboard, we have to get the data ready. We set up a data warehouse, which is a central, organized home for all your business info. We use ETL (Extract, Transform, Load) processes to automatically pull data from your different apps, clean it up, and store it. This means your reports will always be based on fresh, accurate numbers.
Step 4 – Building Your Dashboards
This is the fun part. We design the visual tools your team will use every day. We build high-level executive dashboards for you to see the big picture, and more detailed reports for your department heads. We make sure these are easy to read and work perfectly on mobile devices.
Step 5 – Training and Ongoing Support
We don’t just “drop and run.” We spend time training your team so they know how to use the new tools. We also offer ongoing strategic advisory to help you tweak the system as your business evolves. If you add a new product line or open a second office in Texas, we help you update your data strategy to match.
Key Benefits Of Working With ScalePlot
When you work with a business intelligence partner, you aren’t just buying a new chart. You are buying a more efficient way to work.
| Area | The Old Way (Manual) | The ScalePlot Way (Automated) |
| Reporting Time | Taking 10+ hours a week to build reports | Dashboards update in real-time |
| Data Accuracy | High risk of human error in Excel | Automated, clean, and verified data |
| Decision Speed | Waiting for weekly or monthly meetings | Answers are available instantly |
| Team Focus | Staff spends hours on data entry | Staff spends time on strategy and sales |
| Forecasting | Guessing based on “gut feelings” | Using historical trends to predict the future |
| Visibility | Leaders only see pieces of the puzzle | One clear view of the whole company |
Measurable Results
- Higher Productivity: When your team stops doing manual data entry, they get back hours of productive time every single day.
- Lower Costs: Finding waste in your supply chain or overspending in your marketing budget becomes much easier when the numbers are clear.
- Better Customer Experiences: When you have a data-driven strategy, you can anticipate what your customers need before they even ask.
Real-World Value Across Industries
How does this look in practice? Here are a few examples of how we help different types of businesses in the USA.
Manufacturing and Warehouse Operations
For a manufacturing plant, downtime is the enemy. We help you track machine performance and quality control in real time. If a machine starts to slow down, the data flags it immediately. You can also optimize your inventory so you aren’t paying to store parts you don’t need for another six months.
Retail and E-commerce
In retail, you need to know which products are moving and which are just taking up space. We build sales dashboards that connect your online store with your physical locations. This helps you plan your inventory and marketing around what people are actually buying, not just what you think they like.
Healthcare and Medical Services
Healthcare organizations in Dallas, Texas deal with massive amounts of data. We help them manage resource allocation—making sure the right number of staff is on hand for busy times. We also provide patient analytics that help clinics improve their service levels and reduce wait times.
Logistics and Supply Chain
If you run a fleet of trucks or a delivery service, every mile counts. We help logistics companies monitor route performance and fuel efficiency. By analyzing delivery times and supply chain delays, you can fix bottlenecks and keep your customers happy.
Finance and Professional Services
Finance teams often struggle with disconnected systems. ScalePlot simplifies your financial reporting and budget tracking. We help you look at project profitability so you can see which clients or services are actually making you the most money.
Why Businesses Choose ScalePlot As A Data Partner
There are a lot of analytics consulting firms out there, but we do things differently.
- We focus on the business, not just the code. A technical tool is only good if it solves a business problem. We start with your goals and build from there.
- We have deep industry experience. We have worked with companies across the USA in dozens of different sectors. We already know the challenges you are facing.
- We are a long-term partner. We don’t believe in “one and done” projects. We want to be the team you call whenever you have a big question about your growth strategy.
- We use modern, secure technology. We build on platforms you can trust, like Microsoft Fabric and Power BI, ensuring your data is both fast and protected.
Signs Your Business Needs ScalePlot
You don’t need a “perfect” setup to get started. In fact, most of our clients start because things are messy. You might need ScalePlot if:
- You are tired of seeing different numbers on different reports.
- Your managers spend more time in Excel than they do managing their teams.
- You feel like you are always “reacting” to problems instead of preventing them.
- You have plenty of data but no idea how to use it to grow.
- Your business has grown so fast that your old way of tracking things no longer works.
How To Get Started with ScalePlot
We make the process simple so you can see results quickly.
- Schedule a Call: Reach out to contact ScalePlot for a low-pressure discovery consultation.
- The Assessment: We take a quick look at your current systems and data quality.
- The Plan: We suggest a focused project that will give you the biggest “win” in the shortest time.
- The Build: We handle the data integration and dashboard design.
- The Results: We train your team and help you start using your new insights to drive growth.
Why ScalePlot Is The Right Partner For Data-Driven Growth
Choosing a partner to handle your company data is about more than just finding a tech expert. You need someone who understands how a business actually runs.
Here is why ScalePlot is the right fit for your growth.
Experienced Consultants Who Know Your World
Our consultants have spent years fixing messy data and broken reporting processes. We have seen the common traps that slow businesses down. Because we have done this many times before, we can help you avoid expensive mistakes and get your project moving faster.
A Business-First Approach
We do not start by talking about software or code. We start by talking about your business. We want to know how you make money, where you lose time, and what goals you are trying to reach. The technology is just a tool to help you get there. By putting your strategy first, we make sure the final solution actually solves your real-world problems.
A Method That Works
We do not guess our way through a project. We use a clear, proven plan to get your data organized and your dashboards built. You will always know what step we are on and what to expect next. This structured approach keeps the project on track and ensures nothing important gets missed.
Focused on Results You Can Measure
A pretty chart is useless if it does not help you run your business. We focus on outcomes that matter, such as shorter reporting cycles, better inventory control, or faster decision-making. If a project does not provide a clear benefit to your bottom line, we will tell you.
Committed to Your Long-Term Success
We are not looking for a quick project before moving on to the next client. We want to be a long-term partner in your success. As your business grows and your needs change, we stay by your side to update your tools and help your team adapt. We win when you win.
I’ve narrowed this down to the six most important questions business owners usually ask, Izzy. I kept the answers direct and skipped the corporate jargon.
ScalePlot FAQ: Answers Before You Begin
What exactly does ScalePlot do?
We are a business consulting and data intelligence partner. We help you organize your company’s information so it is easy to read and actually helps you make better decisions. We handle everything from building dashboards to setting up AI solutions.
How does this help me make more money?
Better data helps you find waste, improve your sales efficiency, and spot trends before your competitors do. By automating your reporting, you also save thousands of dollars in labor costs every year.
Will you work with the software I already have?
Yes. Whether you use a major ERP like SAP, a CRM like Salesforce, or just a collection of QuickBooks files and Excel sheets, we can connect them. Our goal is to unify your data, not force you to buy all new software.
Is ScalePlot a good fit for a mid-sized company in Dallas, Texas?
Absolutely. We specialize in helping companies that have outgrown their old manual processes. You don’t need a massive IT budget to get started with professional business intelligence.
How long does a project usually take?
It depends on what you need, but we like to move fast. A focused dashboard project can often be finished in a few weeks. Larger digital transformation projects take longer, but we always work in stages so you see value right away.
Do we really need AI to be successful?
Not necessarily, but it is a powerful tool. We help you figure out if AI consulting is right for your current stage. We only suggest AI if it solves a real problem, like improving your forecasting or automating a tedious task.
Make Data Useful Before You Make It Bigger
Collecting data is only the first step. Just having a pile of numbers does not help you run a better business. Data becomes valuable when it gives you clear insights that tell you exactly what to do next.
ScalePlot helps you turn that raw information into a strategy. We take the confusion out of your reporting so you can focus on growing. When you make choices based on facts rather than guesses, you gain a big advantage over competitors who are still stuck in messy spreadsheets. You can move faster, save money, and plan for the future with confidence.
Do not let your data go to waste. Contact ScalePlot today for a consultation or a data assessment. We can show you a demo of how a custom dashboard could work for your specific business. Let’s start making smarter decisions together.